Browsing Category

Uncategorized

AIR HUMIDITY AND INDOOR AIR QUALITY

Have you ever felt short of breath? Your chest tightens and your respiratory rates increases sharply, Despite all your attempts to increase the inhaled air, it is not enough to support your needs. As exorbitant this narrative might sound, polluted air increases the difficulty to breathe properly. Yet we do not give air pollution the proper importance and coverage it requires. People tend to think that as it cannot be seen, it is not important enough. If only we were aware of what we are constantly putting inside our lungs, concern towards it would increase.

Delhi Air Pollution: Short of breath, when will Delhi get relief from  weather | The Financial Express

Air pollution is responsible for the deaths of thousands of people every day around the world. It is slightly reassuring that governments are increasing the pressure on outdoor pollutants levels. Contrary, the presence of pollutants in indoor air is commonly ignored by regulators. On top of that, indoor air is frequently more polluted than outdoor air. The presence of pollutants indoors is generally 2 to 5 times higher than outdoors.

Humans spend 90% of their time indoor. This together with the poor air quality indoor raises the concern to develop strategies to improve indoor air conditions. Indoor Air Quality exactly pursues this goal. Practitioners aim to continuously analyze and monitor the presence of pollutants indoor to improve conditions to healthy standards. 

Invisible to the human eye, we are exposed to a large range of indoor pollutants. Gaseous pollutants and particulate matter can be easily found in conventional homes. Their effects on human heath can vary from light headaches and irritation of the respiratory airways to more severe affection like cancer.  

One of the main drivers of Indoor Air Quality is Air Humidity. Why? You may ask. Air humidity has a direct effect on the proliferation of airborne pollutants. In this sense, they will develop faster and potentially increase the harm induced to the occupants of buildings, if the Air Humidity conditions are inappropriate. In addition, Air Humidity can play a decisive role in comfort perception.

The effects both on our health and comfort raises the alarm about the importance of Air Humidity control to improve living conditions.  

Comfort perception

Humans’ wellbeing and performance is influenced by all the environmental conditions that surround us. If we want to work up to high standards, among other factors, especial attention should be given to the thermal comfort conditions. This criterion determines the temperature, relative humidity and air movement that ensures occupants are satisfied with the thermal environment.

The perception of comfort may vary from one person to another. Therefore, finding the conditions that ensures that all the rooms occupants will feel comfortable is a tedious and impossible task. The strategy should focus on providing comfortable conditions to the largest number of occupants.

Figure 1. Comfort zone representation in the Psychometric chart. Source: Ohio State University

The psychometric chart, a graphical representation of the thermal conditions of the air, comes as extremely useful to represent the comfort zone. The conditions that ensure that the least number of complaints regarding the air estate are received. In this line, HVAC systems must ensure that the Relative Humidity should be between 40% and 60% and the temperature between 22ºC and 27ºC. Ensuring that the air conditions of a room is within these margins is primordial for a good air quality perception. Moving away from this area, i.e., reducing or increasing the Relative Humidity, will lead to the reduction of comfort.

The effects of low Relative Humidity (levels lower than 30% RH) can be rapidly detectable. In such conditions, tear production is reduced and consequently, eyes will feel dryer than usual. Similar effects will be experienced in the respiratory airways. Moreover, the mucus found in the upper airways will be dehydrated, reducing the efficacy of a natural protection barrier against infections. The effects of low Air Humidity and vocal perturbations have also been covered by researched. It has been concluded that air dryness may lead to an increase in the perceived effort needed for vocal production.

High levels of RH can have a strong effect on workers’ performance. Sweat is the mechanism that our body uses to reduce body temperature. Once sweat evaporates, it reduces the temperature. If high relative humidity levels (levels higher than 70% RH) are found, sweat will not be able to evaporate. Consequently, workers will feel hotter and will be more prone to suffer from exhaustion and dehydration.

Relative humidity also has an influence on the perception of Indoor Air Quality. Researchers have identified that, given the same level of pollutant concentrations, there is a correlation between perceiving lower IAQ conditions and greater Relative Humidity conditions. This effect was diffused as pollutant concentrations sharply increase.


Human health effects

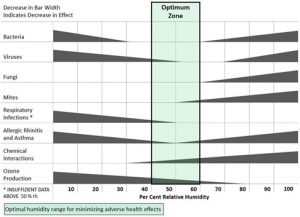
The rate at which chemical reactions occur and the survival of airborne pathogens are dependent on the Indoor Air Humidity Level. Identifying and enhancing the most adequate Relative Humidity level is not trivial due to the large number of species found indoor. Figure 2 perfectly illustrates the main affections that can be identified in indoor spaces and their effect relative to Relative Humidity. The Relative humidity that leads to an increase in the effects of these pathogens and chemical reactions vary from one to another. There is only one range, Relative Humidity between 40% and 60%, that ensure a balance between all the conditions identified. Ensuring Relative Humidity within this range does not mean the air will be free from pathogens. It will only ensure their survival at normal temperature is reduced.

Figure 2. Optimum relative humidity range for minimizing adverse health effects. Source: Arundel et Al.

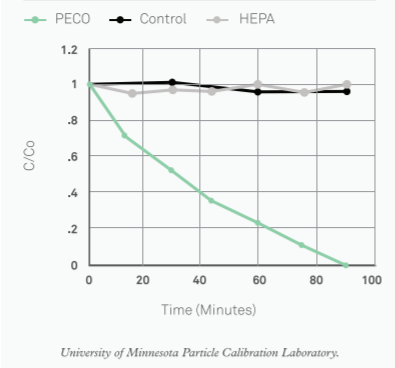
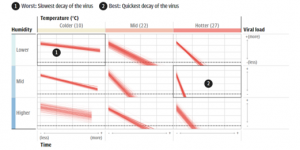
Covid-19 has played a major influence in our society over the last 2/3 years and still does today. The pandemic radically changed the way we lived, leading to an increase in the amount of time spent indoor. All our activities suddenly became indoor. Leisure activities were confined to small apartments, and working from home promptly became the norm. Therefore, special attention was given to find the measures to increase Air Quality and reduce the prevalence of the virus indoors. Previous studies had demonstrated how an increase in Relative Humidity would positively impact viruses decay rates. Based on these studies, research was performed, and the correlation was proven specifically for COVID-19 (Figure 3). Consequently, there was a growing movement demanding the World Health Organization to regulate Relative Humidity levels between 40% and 60%.

Figure 3. What are best and worst environmental conditions for the Covid-19 virus decay. Source: BIORXIV

Is indoor Air Quality regulated?

Regulation in Europe and America seem to go in the same line. In installations that do not include dehumidification and/or humidification capabilities, lower and upper Relative Humidity levels are not limited. Standard 62.1, American design guidelines, only requires practitioners to ensure a Relative Humidity lower than 65% in installations that include a mechanical ventilation systems. European Standards (EN 16798-1) highlight that there is no need to include humidification and dehumidification systems. In case they are present in a room, Relative Humidity Levels should be kept between 20% and 30%.

Conclusion

It has been proved that there is a correlation between Indoor Air Quality and Air Humidity. The effects on our perception of the air quality within a room is an important matter to address. Improper Relative Humidity can lead to discomfort and the increase of the propagation of other airborne pathogens.

A range of Relative Humidity that ensures occupants healthy and comfort (40%-60%) was determined. However, the main standards (American and European) do not seem to give the needed importance to maintaining proper Relative Humidity levels. At the same time, the proposed guidelines are not precise enough and leave room for personal interpretation. Reconsideration of the Standards should be carried out to accommodate them to human needs and healthy.


References

The 40-60 rule: Why relative humidity is necessary for our health. (2021, March 29). Retrieved May 1, 2022, from https://www.condair.com/humidifiernews/blog-overview/the-40-60-rule-why-relative-humidity-is-necessary-for-our-health

Arundel, A. V., Sterling, E. M., Biggin, J. H., & Sterling, T. D. (1986). Indirect health effects of relative humidity in indoor environments. Environmental Health Perspectives, 65, 351. https://doi.org/10.2307/3430203

Fang, L., Clausen, G., & Fanger, P. O. (1998). Impact of temperature and humidity on the perception of indoor air quality. Indoor Air, 8(2), 80–90. https://doi.org/10.1111/j.1600-0668.1998.t01-2-00003.x

Kelly-Linden, S. N. J. (2020, November 2). Who urged to set global guidelines on indoor humidity to curb covid. The Telegraph. Retrieved April 29, 2022, from https://www.telegraph.co.uk/global-health/climate-and-people/urged-set-global-guidelines-indoor-humidity-curb-covid/

Koep, T. H., Enders, F. T., Pierret, C., Ekker, S. C., Krageschmidt, D., Neff, K. L., Lipsitch, M., Shaman, J., & Huskins, W. C. (2013). Predictors of indoor absolute humidity and estimated effects on influenza virus survival in grade schools. BMC Infectious Diseases, 13(1). https://doi.org/10.1186/1471-2334-13-71

Michael Rosone • May 7, 2020. (2020, October 7). Is too much humidity hurting your health? Arista. Retrieved April 29, 2022, from https://aristair.com/blog/is-too-much-humidity-hurting-your-health/

Rehva journal 02/2021 – effects of indoor air humidity. REHVA. (n.d.). Retrieved May 1, 2022, from https://www.rehva.eu/rehva-journal/chapter/effects-of-indoor-air-humidity

U.S. Environmental Protection Agency. (n.d.). Indoor Air Quality. EPA. Retrieved April 28, 2022, from https://www.epa.gov/report-environment/indoor-air-quality#pollutants

Wolkoff, P. (2018). Indoor air humidity, air quality, and health – an overview. International Journal of Hygiene and Environmental Health, 221(3), 376–390. https://doi.org/10.1016/j.ijheh.2018.01.015


Challenges in Monitoring Building IAQ: what and where to measure

Introduction

Have you ever experienced that in the morning, your eyes, nose and/or throat got irritated? You felt fatigued, even though you just had a 10-hour sleep and woke up at 10 am. You felt dizzy, got a headache and even had a feeling of nausea. It seems like you never got enough rest and never had high-quality sleep. One thing that you may ignore but is essential to your health is the air quality in your room, or “Indoor Air Quality (IAQ)”.

IAQ plays a critical role in human beings’ physical condition: research shows that people spend at least 90% of their time indoors [1], including 69% in residence and 5% in office factories [2]. However, it is estimated that 96% of buildings have at least one type of IAQ issue [3]. Long-term exposure to poor IAQ may lead to severe acute and chronic health problems, such as respiratory diseases, lung cancer and heart diseases [4]. Besides health issues, poor IAQ also makes an impactful ramification to economics: indoor air pollutants may reduce human productivity, work efficiency and the ability to process information. It is estimated that 33% to 50% of commercial buildings in the US are affected by poor IAQ, contributing to over 10 million lost workdays per year [5]. Obviously, low-quality indoor air causes not only adverse health effects to human beings but also an economic loss to society. Thus, feasible solutions to detecting, quantifying indoor pollutants, and improving air quality are essential from the perspective of personal health, economics and society.

Figure 1: Pie chart of the percentage of time spent in indoor and outdoor environments [2]. It shows that approximately 90% of the time is spent indoors, including in residential buildings, office buildings, restaurants, and other indoor places such as shopping malls, stores, schools and churches. Data were collected from the United States Environmental Protection Agency (US EPA).


IAQ measurement: what to identify and how to measure

Pollutants affecting IAQ usually come from sources inside a building, though some of them may originate from outsides and are drawn in. The most common pollutants include volatile organic compounds (VOCs), carbon monoxide (CO) and particulate matter (PM) (See Figure 2): VOCs are the main contributors to poor IAQ. These organic chemicals are emitted as gases from indoor products and processes, such as cleansers and disinfectants, wood preservatives, paints, pesticides, dehumidifiers and building materials [6]. Over-exposure to VOCs may lead to eye, nose and throat irritation, headaches, nausea and damaged central nervous system. CO molecules are generated from clothes dryers, water heaters, boilers and stoves [7]. A small amount of CO may cause fatigue and chest pain, and a large amount of CO with long-term exposure may lead to faintness and death*. As CO is colorless, odorless and tasteless, people may not detect the problem until they have already become ill and sick. Thus, it poses a health risk for human beings as an invisible killer. PM is a mixture of solid particles and liquid droplets suspended in the air, such as dust, pollen, smoke and soot. The particles vary in size, and those with a diameter of 10 micrometers or less (PM10) are concerned since they are inhalable and may lead to adverse health effects*. PM2.5, particles with a diameter of 2.5 micrometers or less, have higher respiratory deposition fraction and are more likely to travel into and deposit on the deeper parts of the lung, which may induce tissue damage and lung inflammation [8] *. Besides pollutants, indoor temperature and humidity levels also influence IAQ: high building temperatures and a humid environment may induce chemical reactions, leading to the emission of harmful chemicals.

Figure 2: Illustration of sources of indoor pollutants from different areas in a building [9].

To measure IAQ, different types of measurements are conducted. Conventionally, VOCs are detected by a photo-ionization detector (PID), CO by a carbon monoxide detector and PMs by an optical particle counter. Over the past few years, low-cost IAQ consumer sensors have become available and are mostly used to detect and quantify the levels of various indoor air pollutants. They should be placed in the breathing zone, a height range between 0.9 to 1.8 meters above the floor. Also, they should be placed at least 5 meters away from windows, doors and mechanical ventilation systems.

Figure 3: Breathing zone and the suggested location for IAQ sensors [10]

*According to air quality standards by US Environmental Protection Agency (US EPA), the concentrations of CO and PM10 should not be exceeded more than once per year to the level of 35 ppm during one hour and 150 μg/m3 during 24 hours, respectively, and the mean concentration of PM2.5 should be less than 12.0 μg/m3 during one year.


Challenges in IAQ monitoring

Why is it so important to choose where to place your IAQ sensors? This is because it is not easy to achieve accurate IAQ monitoring! The main reason is that we assume that indoor air pollutants are quickly well-mixed up, which, in reality, is not true. There are various static (e.g., carpets, furniture, wood products) and dynamic pollutant-emission sources (e.g., human beings, pets) in the building. As the concentration of a pollutant is highest at the source and gradually decreases, pollutants are inhomogeneous in the buildings and take time to reach homogeneous conditions. Thus, measurement errors take place and are hard to be avoided.

As it takes time for indoor air pollutants to become homogeneous in the building, the placement of IAQ sensors significantly affects the measurement accuracy: indoor pollutants may accumulate on the floor, on the ceiling and at corners; sensors installed in these regions may receive inaccurate results. Direct sunlight in the region nearby windows, personal heater and humidity in the room may induce chemical reactions; polluted chemicals may be released from these regions and influence the accuracy of IAQ measurement, since the result may overestimate the average of pollutants indoors. Also, regions nearby windows and floor fans may have a stronger ventilation rate than any other region in the room; the measurement may underestimate the concentration of indoor contaminants.

Other than sensors themselves, the location of buildings may also influence IAQ measurement: while buildings in the outskirts and mountain regions may have clean outdoor air, houses in/nearby the manufacturing zones and downtown may have terrible outdoor pollution. If the measurements are undergone in these heavily-polluted regions with ventilation systems on, outdoor pollutants, rather than indoor pollutants, may be dominated in the building; the sensors may detect the concentration of outdoor pollutants instead of indoor pollutants, which may get unexpected results.

Besides the aforementioned factors, the difficulty of airflow rate measurement, the reliability and precision of low-cost consumer sensors themselves, the lack of sufficient data on IAQ studies and robust methods of data analysis over IAQ make accurate IAQ monitoring still difficult.


Summary

From here, we understand that IAQ matters a lot not only to your health and your working productivity but also to society and the economy. A small number of indoor pollutants, such as VOCs, CO and PMs, may interfere with your sleeping quality and working efficiency and even harm your health. Also, IAQ measurements could help monitor IAQ, but many factors may disrupt the accuracy of monitoring.

Some feasible approaches can be applied to improve your IAQ: first, reduce the emission sources in your building, such as using low-VOC carpets on the floor. Second, keep buildings dry. This can prevent you from harmful sources to your respiratory system. Third, protect against outdoor pollutants, so that contaminants will not come in. Finally, ventilate well, so that you will obtain fresh air in the building all the time.

Next time before sleeping, remember to open the window or the door a bit in your room. Improve the ventilation. Let the fresh air in and let the polluted air out. Maybe this small change could make a big improvement in your sleeping quality!


Reference

[1] Indoor Air Quality Monitoring for Enhanced Healthy Buildings, by Gonçalo Marques and Rui Pitarma, IntechOpen, Sep 2018. https://www.intechopen.com/chapters/63898

[2] Indoor Air Quality in Buildings: A Comprehensive Review on the Factors Influencing Air Pollution in Residential and Commercial Structure. DOI: 10.3390/ijerph18063276 https://www.researchgate.net/publication/350285067_Indoor_Air_Quality_in_Buildings_A_Comprehensive_Review_on_the_Factors_Influencing_Air_Pollution_in_Residential_and_Commercial_Structure

[3] The best indoor air quality monitors for identifying indoor pollutants, by Michael Ansaldo, TechHive, Feb 2022 https://www.techhive.com/article/583710/best-indoor-air-quality-monitor.html

[4] CHALLENGES, CONSIDERATIONS, AND CONCERNS OF INDOOR AIR QUALITY, by Bryan Heizmann, Pennsylvania Housing Research Center, June 2015. https://www.phrc.psu.edu/assets/docs/Publications/PHRC%20IAQ%20BB%20FINAL.pdf

[5] Indoor Air Quality Monitoring: How To Test, Measure & Improve, by IotaComm, May 2019 https://www.iotacommunications.com/blog/how-can-you-improve-indoor-air-quality/

[6] Volatile Organic Compounds’ Impact on Indoor Air Quality, United States Environmental Protection Agency. https://www.epa.gov/indoor-air-quality-iaq/volatile-organic-compounds-impact-indoor-air-quality

[7] Carbon Monoxide Poisoning: Health Effects (AEN-166)

https://www.abe.iastate.edu/extension-and-outreach/carbon-monoxide-poisoning-health-effects-aen-166/                                                         

[8] Inhalable Particulate Matter and Health (PM2.5 and PM10)

https://ww2.arb.ca.gov/resources/inhalable-particulate-matter-and-health

[9] Indoor Air Quality Infographic 

https://www.andatechdistribution.com.au/blogs/resources/indoor-air-quality-infographic

[10] Where Should You Install a Commercial Air Quality Monitor?https://learn.kaiterra.com/en/resources/where-to-install-commercial-air-quality-monitor

Indoor Air Pollution in Wooden Construction Buildings

Sustainable buildings made of wood with a good indoor climate and positive life cycle assessment, but what about air quality?

Wood is a building material that has become increasingly popular in recent years. This is due to many advantages that the natural raw material brings with it. Thanks to a high degree of prefabrication, construction projects can be realized quickly, and the low weight of the building material also brings some advantages. The building material is locally available in Europe and is also sustainable. Nevertheless, the connection between sustainability and a construction made of wood must be viewed critically, since various influencing factors, such as forestry, must be taken into account. Nevertheless, because of to the rethinking in terms of resource consumption, timber construction will become more and more important in the future and the usage will increase. In the following therefore, the building material timber will be considered with regard to the effects on indoor air quality, since there are currently still few regulations and statements on the health impact of wooden constructions.

Emissions caused by timber or wood-based material

To describe the air quality in wooden buildings, especially the VOCs are of great importance. VOCs, volatile organic compounds, are substances such as alcohols, aldehydes, ketones, ethers, acids from the group of carbonyl compounds or terpenes. Wood is composed of the three main components cellulose, hemicellulose and lignin as well as the extractives. The extractives make up only a very small proportion in wood but are responsible for VOC emissions and other specific properties. These pollutants are associated with negative effects on air quality. Thus, there may be negative effects on the health of building occupants, such as sick building syndrome (SBS). [1]

VOCs can be of natural or anthropogenic origin. Wood naturally contains terpenes. In the case of pine wood, terpenes account for 90 percent of TVOCs (sum of all VOCs). In addition to terpenes, aldehydes and acetic acid play a minor role for indoor air quality. In general, each wood species emits differently. It also depends on where the tree grew, and which part of the wood was tested (e.g. split-/ heartwood or juvenile/ adult wood). For the common species like pine and spruce is research data available, but for the conifers larch or Douglas fir there are hardly any reliable values. The increasingly important hardwoods are also poorly researched in terms of their emission behavior. [2]

Wooden buildings

In modern timber construction, there are precise processes for the treatment from wood to timber. Due to cost, usability and material savings, solid wood is rarely used, but rather various wood-based materials. For ceilings for example, cross-laminated timber panels (CLT) are usually installed, beams can be built out of solid wood or glulam and there are many other products on the market.

The following figure describes the composition of various wood-based materials and the connection with several health effects. The wood-based materials such as cross-laminated timber (CLT), oriented-strand board (OSB), chipboard panels and many other products show a different emission behavior because they are often mixed with flame retardants, hardeners and adhesives (usually UF, MF, PF and PMDI).

Figure 1: Volatile organic compounds (VOCs) from wood and wood-based panels: their sources and impact. [1]

Conclusion

Emission behavior of wood and wood-based materials is investigated by several studies due to their relevance for human health. The following figure shows the TVOC concentration over time. At the time of installation, the TVOC concentration is strongly increased. After approximately eight months, the emissions equal to a value obtained in a conventional reinforced concrete structure. The study also distinguished between timber-frame (TF) and solid wood (SF) construction types, as the installation situation can mean large differences in indoor air quality.

Figure 2: Long-term progression of TVOC emissions— comparison of construction types (SW – TF). [3]

Various measurements have shown that primary emissions, such as terpenes, exhibit a rapid decay behavior. Secondary emissions (in wood mainly from aldehydes), however, increase in part at the beginning of the installation and subside only after several weeks. Controlled ventilation can also reduce emissions by almost half compared to manual ventilation. For environmental and energetic reasons, buildings are now being built much more tightly than in the past. And due to the good thermal properties, wooden buildings are usually very tight and fulfill even the highest tightness requirements. [3]

Even though building with wood becomes more and more popular, there is still a lack of scientific research and standardized limit values for air quality in wooden buildings. The emission behavior has been researched in principle, but as described above, it varies greatly. In general, the installation situation must always be taken into account. [2]

Several independent studies have shown that thermal treatment of wood can reduce VOC emissions. It also accelerates the decay of emissions. With a proper drying process, wood can generally be considered as a harmless material for indoor use. In the coming years, manufacturers of wood-based materials will be expected to provide reliable information on their products. As already mentioned, the emisson behavior of a natural building material depends on many factors and should be investigated by each manufacturer on a product-specific basis and generally regulated by official requirements.

References:

[1] Adamová, T.; Hradecký, J.; Pánek, M. (2020): Volatile Organic Compounds (VOCs) from Wood and   Wood-Based Panels: Methods for Evaluation, Potential Health Risks, and Mitigation, DOI:10.3390/polym12102289

[2] Butter K, Ohlmeyer M (2021) Emissionen flüchtiger organischer Verbindungen von Holz und Holzwerkstoffen. Braunschweig: Johann Heinrich von Thünen-Institut, 102p, Thünen Rep 86, DOI:10.3220/REP1622449526000

[3] Fürhapper, C.; Habla, E.; Stratev, D.; Weigl, M.; Dobianer, K. (2020): Living Conditions in Timber Houses: Emission Trend and Indoor Air Quality, DOI:10.3389/fbuil.2019.00151

Flame retardants: Friends or Foes

Introduction

Fire has been one of the most revolutionary discoveries for human beings. It immediately became something of great value for humans. It gave protection, for example from cold, but also from enemies and predators. Today the opinion about fire is very different, almost the opposite. People in principle are afraid of it, both because of the effects it can cause on the body and because of the destructive effects it can have on things (structures, goods, vegetation, etc.). More and more, people considered fire as an element to keep under control. At first it was enclosed in chimneys, then various extinguishing media and appropriate rescue services were developed. Then people went further and invented substances that try to limit the effects of fire on things, known as “flame retardants”. The purpose of these substances is to counteract the spread of fire by hindering combustion reactions, to reduce damage and risk as much as possible. At first impression, therefore, we might think that these substances are our friends, and indeed, if we consider their effectiveness in saving lives and reducing economic damage, we can say that they are by our side. But as it is often the case, we must investigate further to find downsides even in the things that protect us, such as the use of these substances. Since 1970s there has been a huge boom in the production and use of flame retardants worldwide. Manufacturing industries started applying these substances to all kinds of products, as they were considered to bring safety to customers. The construction, electronics and transport industries have been the main users of flame retardants. Around the 2000s, however, people became more skeptical about these products because of toxic substances found in the environment, in animals, food, households and even in humans. These emitted substances were related to flame retardants. In principle, very low concentrations of dioxin were involved, which could not even be considered as dangerous, but still theoretically as toxic. In view of the enormous development of trade in these substances, some of these products were restricted or banned in the early 2000s. At the same time, new, increasingly specific, and effective regulations have been introduced to reduce the side effects of these substances.

The 4 steps in the flammability process

When a polymer ignites there are four steps that follow one another. The first step is “preheating” in which the material is brought to a high temperature by an external source, at which combustion is encouraged but not yet triggered. Then comes “decomposition” in which the material begins to degrade, losing its properties. In this phase, various gaseous products are developed. At this point we proceed to “ignition”, which is the ignition of gases through oxidation. From this point, if there is enough heat, the flame no longer needs the external source, and the material burns on its own. We are therefore in the “combustion and propagation” phase. Figure 1 shows this process in a schematic way.

As already mentioned, flame retardants act precisely in these phases, trying to delay the next steps to prevent combustion and propagation.

Figure 1: The four steps of the flammability process

The 4 main categories of flame retardants

Inorganic flame retardants: When the material burns, these flame retardants decompose and produce non-flammable gases, which, when mixed with flammable gases, limit their ability to burn. They also decompose and form a thin layer on the burning material and prevent the access of oxygen and heat (essential for the combustion process).

Halogenated organic flame retardants: With the help of these flame retardants, hydrogen and hydroxide are removed from combustion. Thus, by removing the radicals and replacing them with Br or Cl molecules, the fire is retarded.

To this category belong bromine flame retardants, which are a major source of toxic emissions and for which many new standards have been introduced. At the same time, these substances show very interesting advantages due to their cost-effectiveness, processability, miscibility and minimal influence on the mechanical properties of the material to which they are applied. To give an order of magnitude, it is estimated that the consumption of brominated flame retardants in 2002 was about 150,000 tons/year (of which 25% was used in Europe).

Phosphorus containing flame retardants: In this case, the flame retardant oxidizes during combustion to create phosphorus oxide, which interacts with the water emitted by the material and become phosphoric acid. The latter induces a rapid release of water from the substance being burned, making it a residue that no longer burns and limiting the production of flammable gases. These flame retardants are considered a good substitute for bromine flame retardants, as they produce significantly less emissions.

Nitrogen containing flame retardants: During combustion, these flame retardants produce gases which form a thin insulating layer. This means that the entry of heat necessary for combustion is not guaranteed and the material cannot burn.

It is important to emphasize how these flame retardants behave to understand how they work. The aim is to use substances which intervene in one of the first stages of flammability by limiting the heating rate, to delay or avoid actual combustion. For this reason, there are two main ways of acting. The first consists of limiting the access of oxygen to combustion through the production of non-flammable gases. The second involves the energy which is taken up by the flame retardants and removed from combustion, to reduce temperatures and prevent ignition.

Flame retardants can be used in the form of additives (which easily release substances into the environment), finish and surface coatings, comonomers and polymeric structures.

Collateral effects of flame retardants

Although flame retardants (mainly bromine and chlorine based) are known to emit toxic substances, it is still difficult to determine the pathways these substances follow (in Figure 2 the main emission ways are shown). For this reason, they should be thoroughly monitored, reconstructing logical pathways such as material dumps, industrial production areas, releases from residential zones, major fires, etc.

Figure 2: Emission ways for brominated and chlorinated flame retardants

Concentrations in air tend to be very low but cannot be underestimated. In water, on the other hand, higher concentrations can be found, meaning that aquatic ecosystems are more affected by these toxic substances. In fact, traces can be found in animals, such as fish, mammals and birds.

The effects of these substances can be slight reduction in memory and learning capacity. Similarly, some immuno-toxicity and neuro-toxicity (especially for exposures in the period of neuronal development) have been observed.

These concentrations may also be harmful to humans, especially as they have continued to increase in the last decades. It has been found that traces of these substances are often diet-related, and indeed, in Germany, traces (increasing over time as shown in Figure 3) have been found in the blood of tested patients. The food richest in these toxic substances is fish, which, as mentioned, intake the substances in water.

Figure 3: Concentrations of polybrominated diphenyl ethers in blood samples of german patients

Future challenges

Since the 2000s, when the restrictions started to emerge, there has been discussion about sustainable flame retardants. The problem with these products is that they must be applied in large quantities to be effective against fire and this leads to a reduction in the mechanical properties of the substrate material.

Around 50% of fire deaths are related to breathing in smoke and gases. For this reason, we cannot allow harmful gases to be produced from substances added to a material that should reduce the impact of the fire on humans. It is precisely for this reason that new substances must be developed, to better protect people, without intoxicating them or having short- or long-term health impacts.

References

Eli M. Pearce and R. Liepins, Flame Retardants, Environmental Health Perspectives , Jun., 1975, Vol. 11 (Jun., 1975), pp. 59-69, https://www.jstor.org/stable/3428325

Ali I. AL-MOSAWI, Flame retardants, their beginning, types, and environmental impact: a review, Journal of Silicate Based and Composite Materials, 2021, https://doi.org/10.14382/epitoanyag-jsbcm.2022.01

Li Chen and Yu-Zhong Wang, A review on flame retardant technology in China. Part I: development of flame retardants, Polym. Adv. Technol, 2009, (www.interscience.wiley.com) DOI: 10.1002/pat.1550

Ike van der Veen, Jacob de Boer, Phosphorus flame retardants: Properties, production, environmental occurrence, toxicity and analysis, Chemosphere, 2012, http://dx.doi.org/10.1016/j.chemosphere.2012.03.067

Robin J. Law, Levels and trends of brominated flame retardants in the European environment, Chemosphere, 2006, doi:10.1016/j.chemosphere.2005.12.007

Cynthia A. de Wit, An overview of brominated flame retardants in the environment, Chemosphere, 2002

Isao Watanabe, Shin-ichi Sakai, Environmental release and behavior of brominated flame retardants, Science direct, 2003, doi:10.1016/S0160-4120(03)00123-5

Linda S. Birnbaum and Daniele F. Staskal, Brominated Flame Retardants: Cause for Concern?, Environmental Health Perspectives, 2004, doi:10.1289/ehp.6559

Per Ola Darnerud, Toxic effects of brominated flame retardants in man and in wildlife, Science direct, 2003, doi:10.1016/S0160-4120(03)00107-7

https://www.bafu.admin.ch/bafu/en/home/topics/chemicals/info-specialists/chemicals–regulations-and-procedures/flame-retardants.html

Environmental Tobacco Smoke

We’ve all been there: enjoying a nice time out with friends or family when, as usual, someone decides to light up a cigarette. Depending on the country you’re in and the rules in place, this person may even be lighting up in an indoor environment like a restaurant or bar. At this moment a few thoughts pop in your head: this smells, and probably more importantly is this smoke killing me? Well, you’re in luck! This blog post will answer the second question and a few other questions you may have on tobacco smoke. In the following paragraphs, we will go in depth into the origins, composition and consequences of environmental tobacco smoke

To begin, let’s define tobacco smoke. Tobacco smoke is composed of two elements: “active” smoke, and “passive”, or environmental, smoke. The second type is also referred to as second-hand smoke. Active smoke is what is inhaled by the smoker and never gets released in the air. This smoke is a major health hazard for the smoker themselves as it enters their lungs and body. Passive smoke is composed of “mainstream” smoke that is exhaled by the smoker, and “side stream” smoke that is passively released by the cigarette without going through the filter. Sidestream smoke is what you see coming out of a lit cigarette on an ashtray or in the smokers’ hands. Both types of smoke are called environmental tobacco smoke, which will be abbreviated as ETS from now on. ETS is created by combustion of tobacco products like cigarettes, cigars, pipes, etc… 

ETS and its two subtypes, mainstream and side stream smoke, are composed of over 4000 different compounds and chemicals. The following table provides a shortened list of some of the compounds that are present in ETS in unfiltered cigarettes: 

Table 1: Emissions of selected tobacco smoke constituents in fresh, undiluted mainstream smoke (MS) and diluted sidestream smoke (SS) from unfiltered cigarettes according to the US Environmental Protection Agency (EPA) report 


(Source: Jaakkola & Jaakkola, 1997) 

As we can see, all the substances above are at the very least toxic, and at most known human carcinogens. First, we observe the presence of benzene, a highly carcinogenic substance also found in car exhaust and is a major contributor of smog in urban areas. We can also notice the presence of ammonia and formaldehyde, substances found in certain consumer products and furniture. Most of these compounds have a larger SS/MS ratio, meaning they are found more frequently in sidestream smoke compared to mainstream smoke. In all cases, these compounds are detrimental to human health. A less complex image of some these compounds and elsewhere we can find them is shown below: 

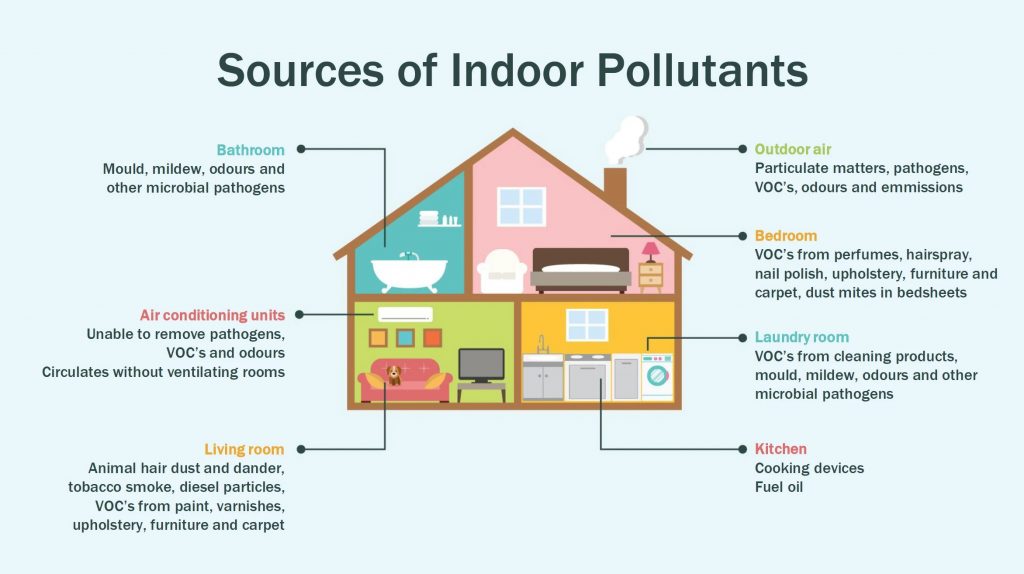
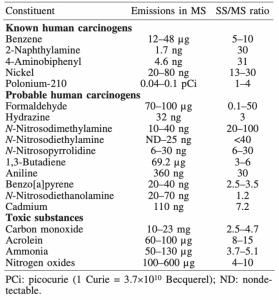
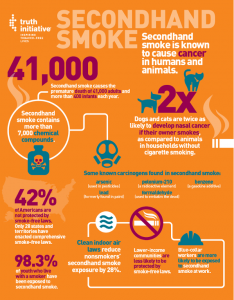
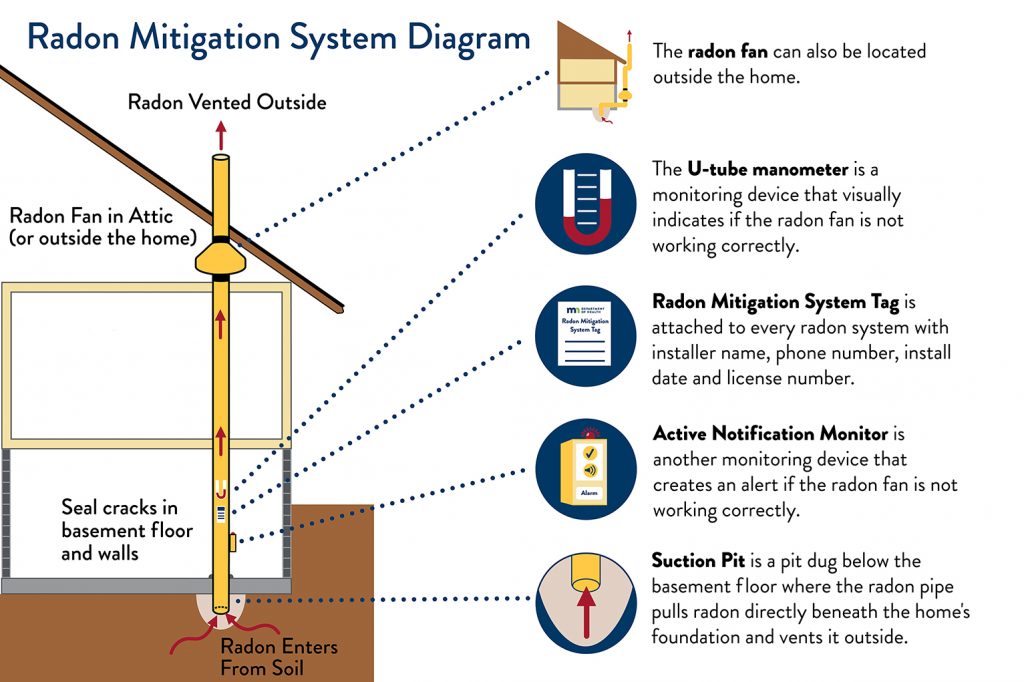
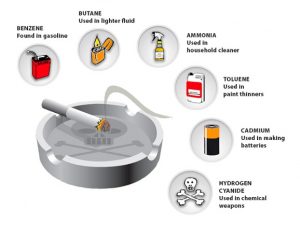
Image 1: Common toxins found in ETS

(Source: CDC) 

Now that we have defined ETS, it is important to know where it is most commonly found: inside homes, cars and, in many countries, restaurants and bars. ETS is known to linger due to its complex mixture of particulate and gaseous matter. In general, mainstream smoke (directly inhaled then exhaled by the smoker) is in a gaseous (vapour) phase which, due to a higher burn temperature, presents slightly less carcinogenic compounds than sidestream smoke which is in a particulate phase. This is much more harmful to the people in the vicinity of the smoker and is thus a much more harmful type of secondhand smoke. As well, sidestream smoke is more likely to attach itself to fabric and textiles inside the home or on one’s clothes. This is one reason smokers’ clothes, cars and furniture frequently smell of smoke even without a lit cigarette nearby. The following image taken from a report by The Truth Initiative, the United States’ largest anti-tobacco nonprofit group, outlines the health effects that smoke, and particularly sidestream smoke (ETS) has on human (and animal!) health and indoor air quality: 

Image 2: Poster outlining health and societal effects of second-hand smoke  

(Source: Truth Initiative)  

As the poster (and the full report linked at the end of this post) shows, ETS presents grave dangers to human health and overall indoor air quality. The presence of smoke-free laws is a major contributor to reducing exposure to ETS as it is one of the only ways to ensure this smoke does not enter or remain in indoor spaces. Even with advanced ventilation systems, the toxicity and ability of smoke to remain attached to surfaces and fabrics ensures that the room will conserve tobacco odours and present less than ideal air quality for days, weeks or even months on end. It is for these reasons that the best way to ensure proper indoor air quality with regards to tobacco is to simply ban smoking in all indoor public spaces. No amount of ventilation will ever replace the advantages of not exposing the space and occupants inside from this smoke in the first place.  

To conclude, we have seen what tobacco smoke is made of and what the major differences between primary and second-hand smoke (ETS) are. We have then outlined the major toxic elements present in this smoke and the impact that all these compounds have on the human body and indoor environments. The impact of smoke on air quality is immense and should be treated as a true public health issue. And yet, we already know of a simple yet paramount solution to dealing with ETS: outlawing its presence indoors in the first place! This move not only allows all occupants to enjoy cleaner air, but also preserves their short term and long-term health. Hopefully you will now be able to show this post to that one smoker you know and maybe, just maybe, they’ll choose to light up outside instead… 

References

[1]  Jaakola, M., & Jaakkola, J. (1997). Assessment of exposure to environmental tobacco smoke. European Respiratory Journal, 10, 2384-2397. 

[2]  Law, M. R., & Hackshaw, A. K. (1996). Environmental tobacco smoke. British Medical Bulletin, 52(1), 22-34. 

[3]  Truth Initiative. (April 2018). Secondhand Smoke. Washington, DC: Truth Initiative. Accessed at: https://truthinitiative.org/research-resources/harmful-effects-tobacco/secondhand-smoke

[4]  WHO Regional Office of Europe. (2000). Air Quality Guidelines – Second Edition . Chapter 8.1 Environmental Tobacco Smoke. Copenhagen, Denmark. 

[5]  Secondhand Smoke. Wikipedia.com 

[6]  Tobacco Smoke. Wikipedia.com

[7]  CDC.gov

[8]  Health Canada Website: Tobacco. Accessed at: https://www.canada.ca/en/health-canada/services/health-concerns/tobacco.html

[9]  American Cancer Society: Secondhand Smoke. Accessed at: https://www.cancer.org/healthy/stay-away-from-tobacco/health-risks-of-tobacco/secondhand-smoke.html


Indoor Radon: Sources, Exposures, Health Effects and Controls

Do you smell it ?

That radioactive but noble smell tingling your senses as it is coming up from your basement and your Geiger counter crackles faster and faster. It surrounds you quickly and you cannot fight it… You ask yourself: “why me ?” “How did it get in my home?” “Damn you, Radon !”, as you exhale your last breath and everything fades away…

Wow… That was dark. But fortunately, that is not exactly how Radon will affect you, in reality, you will not even smell Radon coming for you !

Alright, alright… Enough joking around. What is radon and why does it seem so bad? Let’s find out!

Radon is a noble gas with the symbol Rn and atomic number 86. It occurs naturally in the slow but certain decaying chain of thorium and uranium into lead. It is the direct decay product of radium, an alkaline earth metal. It is a odourless, colourless and tasteless gas that is also radioactive with a half-life of only 3.8 days, making it an extremely rare element.

However, it remains a dangerous gas because of its radioactivity and its ability to accumulate in our cellars.

As Radon forms in uranium rich soils, it slowly creeps up to the surface and can infiltrate the building’s lower floors trough the cracks, construction joints, service pipes, etc… And it can also contaminate water supply. The concentration builds up in the basement because its mass is greater than the air’s.

Radon creation and path to the surface.

This kind of indoor air pollution was first documented in 1950 but had to wait until an incident in 1984 to get widely known. This incident was about a nuclear plant worker undertaking a routine monitoring and finding that he had been contaminated with radioactivity, despite the nuclear plant having never been loaded with uranium nor being in use. Later was found out a high radon concentration in that worker’s home. Since that time, some countries have created maximum radon concentration recommendation and developed ways to mitigate its build-up and the adverse health effects it can have on the population.

These effects on health have been studied since the radon pollution discovery and the main thing we can get from these is that radon can be the cause of lung cancer because of its radioactivity. Relationhips with other diseases remain to be proven to this day. Radon has been identified as the second greatest cause of lung cancers just behind smoking. To be fair, 75% of all lung cancers can be attributed to tobacco use, but still, radon remains an important matter to address. So how can one protect himself from exposure and its adverse effects on lungs ?

First, you should find out if you live in a high radon emittance zone or not, meaning if the soil you live on is rich in uranium or not. For example, in Switzerland, the government conducted a large radon measure campaign and mapped the probability of exceedance of the recommended radon concentration on the whole territory.

Probability of exeadance of radon concentration in Switzerland

If you live in a medium or high concentration zone or have no data available for your location, you should get the exact concentration in your building measured. Otherwise, if you live in a low concentration

zone, you should follow official recommendation, but often, there is no need to worry too much about it.

Radon pollution, unlike other air pollutants, is not measured with mass per volume or molar concentration. It is instead measured with radioactive units, usually becquerel per cubic meter (Bq/m3). 1 Bq is equal to one radioactive decay per second; around the world, outdoor radon concentrations correspond on average to 10 Bq/m3. Other units like picocuries (pCi/L) are also used in some countries. In Switzerland, the maximum radon concentration under which it is deemed safe is fixed at 300 Bq/m3.

For the measurements, you can choose to make them yourself or have them made by a professional. Self-measurement kits can be bought and consist of a can that you leave in your basement for a fixed amount of time, that you close and send to the lab for measurements. These tests can vary a lot depending on the place at which you place it. It may be good to leave several cans at the locations you think are the most relevant. Alternatively, you can ask for a professional to come in your home to take some measurements with a special device that will provide you with real time results depending on where you place it. This eliminates the location imprecision as you can make a lot of measurements.

Try not to ventilate the measurement rooms more than what you usually do as it could skew the results.

“And then, what happens if my home has higher radon concentration than the recommendations?” you may rightfully ask. Don’t worry! There is an easy way to fix it. The most economical way to do it is a ventilation system that prevents the radon from entering your home by creating a low-pressure path. This only consists of a hole in your basement slab, a pipe connecting the hole to the outside and a weather-resistant fan fixed on the pipe. With this device, radon will be redirected outside and won’t build up in your basement.

Radon mitigation system using a fan.

If you’re building new, you may want to plan for the mitigation of radon before it becomes a problem. For that, you need a perfect sealing of your foundation and more generally of every wall in contact with the ground. In civil engineering, this means putting enough reinforcement in concrete so that it will not crack at any time.

References :

-Health effects of radon exposure. Kang J.-K, Seo S. Jin Y.W. July 2019 published in Yonsei medical journal.

-Radon: an overview on health effects. Field R.W. 1 january 2011 published in encyclopedia of environmental health

-Lung cancer in never smokers – a different disease. Sun S. Schiller J.H. Gazdar A.F. October 2007 published in Nature Reviews Cancer.

-Health risks due to radon in drinking water. Hopke P.K. & al.

-Radon in homes and risk of lung cancer: Collaborative analysis of individual data from 13 European case-control studies. Darby S. & al.

Radon – Wikipedia

Radioactivity – Radon.com

Carte du radon en Suisse (admin.ch)

Radon: Health risks and limit values (zila.de)

Radon Mitigation System – EH: Minnesota Department of Health (state.mn.us)


Indoor Nanoparticles: sources and exposure

Figure 1 Some prominent UFP sources: laser printers, combustion processes, electric motors and tobacco smoke.


Nanoparticles: What are they?

Nanoparticles, also called ultrafine particles, are solid substances of 100 nanometres or less in diameter. UFP are present in all kinds of environments both outdoors and indoors; in 2008, emissions in the whole of Europe were estimated around 271’000 tonnes.

UFPs are under scientific scrutiny, mainly due to how easily they can penetrate in the human body, via inhalation, consumption or even dermal contact.

Indoor nanoparticles: a complex cocktail

Nanoparticles can be produced both indoors and outdoors. They are generally divided in two categories depending on its origin: particles of combustion and non-combustion origin.[1]

Combustion is the most prominent origin, as in this category fall very common instances like cooking, smoking or candle flame. In contrast, the main non-combustion sources of nanoparticles are emissions from brush electric motors (common example are vacuum cleaners) and chemicals like air fresheners and perfumes.

Other sources, prevalent in office buildings, are laser printers. These include volatile or semi-volatile organic compounds that are mainly diffused by the fuser used to stick the ink to the paper, as well as other substances present in printers, like flame retardants. This should not be a surprise as the fuser can reach temperatures up to 210°C during printing, and particle emission rates from most materials increases with temperature.

A similar process can be observed in 3D printers, as their working principle relies on heating various thermoplastic materials, usually plastics. As plastics are organic compounds, these processes, in which the nozzle temperature can reach 240°C, release many types of VOCs. 3D printers are however way less common.

Outdoor emissions are the most common. These, although generated outside, can still penetrate inside built environments trough air exchange. This penetration can be estimated through the infiltration factor F_in :

F_in = (a • P) / (a + P)

Where a  is the air exchange rate, P is the penetration factor and K is the deposition rate of the considered particle.

The most common outdoor sources are:

Natural:

The main natural emitters of UFPs are forest fires and volcano eruptions. Like most combustion processes, these reactions create a great quantity of ultrafine particles. They happen usually far from urban centres, However, so they get considerably diluted and mixed with less contaminated air.

Another source of UFPs is marine aerosols, present in coastal areas. This kind of nanoparticles does not include combustion residues, instead being composed for the most part of biogenic particles, generated by algae and plankton. These substances can then suffer ulterior transformations and divisions due to sunlight exposure (photolysis).

Industrial:

Many industrial processes emit particles of all kinds and sizes. The kind of particle emitted depends heavily in the materials and transformations that take place, but mostly originate in combustion processes.

One example are steel factories. Observations made show the presence of heavy metal dusts and polycyclic aromatic hydrocarbons (known as cancerogenic) of very small size, below 100 nm.

Another example would be waste incineration plants, which are critical since a variety of materials are burned, potentially creating a myriad of different nanoparticles. Measurements have shown that despite heavy decantation and filtering, nanoparticles are still being dispersed. Chemical elements with lower boiling points, like arsenic, Cadmium or zinc are prevalent in their composition.

Transport:

The transportation industry is another important source of nanoparticles, due to the multiple combustion processes involved. Road, marine and air traffic are considered the most responsible.

Domestic heating:

Heating systems that rely on combustion are also important sources of nanoparticles. Heating may run on a variety of fuels like wood, coal, and oil, but the production of nanoparticles is mostly attributed to solid fuels. Biomass, which is used as an ecological alternative to traditional fuels, also contributes to the production of nanoparticles.

Of course, some sources are more relevant than others when it comes to indoor penetration: for example, road traffic and domestic heating emissions are more relevant in urban contexts. Considering the multiple origins of UFPs, every location is exposed to its own particular mix of nanoparticles. And, as if things were not complicated enough already, these nanoparticles are subject to all kinds of transformations due to sunlight exposure and reaction with other substances.

Different sources, different exposures

As it can be seen, most pollutants are produced outside. The critical situation is however found inside buildings, mainly due to differences in exposure. But what is exposure?

Exposure is, simply put, the product between the concentration of a pollutant in a certain environment and the time spent in such environment.

Of course, each day a person will enter multiple environments, each one with a different concentration. So, the final exposure is the sum of the concentrations of each environment, integrated over time.

The key point here is the time of exposure.  Although people like to blame Covid for not being able to go outside, people didn’t spend that much time outside to begin with; a person will, in normal conditions, spend from 10 to 20 times more time inside than outside. This means that, even if the concentrations may be smaller indoors for certain pollutants, the exposure to the same pollutants may be higher indoors, where the residence times are much higher. In any case, for UFPs, indoor particles stay predominant indoors. [2]

As it can be seen in the figure above, nanoparticles of 100 nm or less in diameter reach concentrations of 20’000 – 50’000 particles per cubic centimetre. It’s more difficult to state the concentrations directly inside breathing zones, as the concentration of any pollutant can only be considered constant under some specific circumstances. Distance from the particles’ source definitely plays a role in local concentration levels.  

The size of these particles plays a vital role in exposure: being light, their deposition is lower compared to bigger particles, but on the other hand, resuspension from human activities is also low.

Present (and future) challenges

All things considered, UFPs represent one of the latest challenges in indoor air quality, but also in the medical field. Their size is so small that they can infiltrate de bloodstream, potentially bringing other dangerous substances together with them. Because of this, they are suspected to be at the origin of many respiratory and cardiovascular pathologies. Their prevention, as well as their identification and potential risks, are and will be a topic of intensive research in the foreseeable future.

Sources:

[1] Manigrasso et al., “Where Do Ultrafine Particles and Nano-Sized Particles Come From?”

[2] Wallace, “Indoor Sources of Ultrafine and Accumulation Mode Particles.”

Emerging HVAC Filtration and Air Cleaning Technologies

Air pollution is one of the ten biggest global health threats as stated by the World Health Organization (WHO) due to it’s devastating toll of nearly 7 million death every year as consequence of related illnesses, be for people with preexisting conditions such as allergies or healthy ones [1]. This is mostly attributed to the burning fossil fuels as the main pollutant for outdoors spaces, but indoor air is 3 to 5 times more polluted than outdoors on average and as seen that we spend nearly 90 percent of our time indoors this issue is far more alarming.


Existing technologies

As of today, and during the development of air filters during the 20th century, High Efficiency Particulate Arresting (HEPA) filters have been the top of the line product used when cleansing air for medical rooms or when dealing with allergies at home. Air filters equipped with this technology can absorb up to 99.97% of all particles, like allergens pollen, dust, dander, and others that are 0.3 microns in size but with the current technology development new techniques are emerging that might out perform and revolutionize the industry. In this context many new technologies are being developed all over the world, generally trying to target more specific problems or even creating new technologies and systems as a whole to tackle the issue.


Photocatalytic Oxidation (PCO)

Among these two different technologies stand out from the rest, the first one being Photocatalytic Oxidation (PCO) [2]. This technology was first used by NASA when planning for deep space exploration as they needed to deal with the ethylene gas destroying plants and vegetables in the space shuttle. It was then, because of the impossibility of letting this gas flowing into the atmosphere as it would in earth that they came up with PCO. This principle focuses not on filtering or capturing the VOC in the air but on removing them by using titanium dioxide (TiO2) as a photocatalyst having the advantage of limiting the introduction of unconditioned air to the building space allowing to achieve energy savings when compared to other systems. The basic mechanism POC is that malignant organic contaminants would be oxidized into water, carbon dioxide or any inorganic harmless substances with OH or O2 radicals, which are generated around TiO2 under ultra-violet light irradiation [2].

Picture 1: PCO process

Further test done by NASA revealed that it wasn’t only beneficial to eliminate ethylene gas but also to destroy all carbon-based impurities in the air such as: Bad Odors, Volatile Organic Compounds (VOC’s), mold, fungi, bacteria, and viruses [3].

This technology is currently used as both a portable unit for use in households and as a commercial in-duct unit system for large lab installations. PCO is not a filtering technology, as it does not trap or remove particles, so it is common to see it being used together with other technologies such as HEPA (high efficiency particulate air) in a multi-step process to remove other particles of up to 300 nm.


Photo Electrochemical Oxidation (PECO)

Following the PCO another emerging technology is a recently developed one by the company called Molekule created by Dr. D. Yogi Goswami, Distinguished Professor and the Director of the Clean Energy Research Center at the University of South Florida who has performed extensive research on indoor air quality [4]. The name of this technology is Photo Electrochemical Oxidation (PECO) which similarly to the previously mentioned PCO uses light to excite a nanoparticle coated filter, creating reactions on the surface of the filter that results in the creation of hydroxyl free radicals. They are then used to oxidize pollutants at the surface of the filter and converts them into harmless elements such as water or carbon dioxide. The main difference with PCO is that due to a patented innovative manipulation of the electron flow the PECO works orders of magnitudes faster than conventional PCO techniques, allowing the use of lower energy UVA radiation as the light source and thus, reduce the energy consumption while achieving improved performance.

The company responsible for its creation claims this technology can catch particles 1000 times smaller than the existing High Efficiency Particulate Arrestance (HEPA) which are considered some of the most efficient air filters used in hospitals. To back this up some studies performed by independent researchers proved than when measuring some of the most difficult pollutants to remove from air (0.02 nm) the PECO system vastly outperform preexisting technologies.

Picture 2: Comparative of PECO vs HEPA in VOC filtration

Many other tests were run confirming the superiority of PECO technology such as the removal of viruses, bacteria and mold, providing full spectrum of indoor air pollutants destruction [5].

This technology is now being implemented in home devices commercialized by Molekule as we can se in the picture below and consisting in a 4-part process at a price of 799$. As a first step the air intake is produce thanks to a small motor and in a 360º fashion to increase the air renewal rate and prevent stagnation in some parts of the room. Then a prefilter, most likely a HEPA although not specified captures the larger allergens and slows the intake of smaller VOCs to prevent the PECO system to saturate. Finally, the smaller particles are then run through the PECO filter to achieve the process explained above and result in clean air for the room without the need of outdoors ventilation.

Picture 3: Molekule product breakdown

Conclusion

Overall we can see how the evolution of HVAC filtration and air cleaning technology is following the right path of evolution to guarantee a better living environment for households, but have yet to see these new technologies implemented in buildings as a default setting and affordable prices to standardize this level of indoor air quality. Nonetheless, the emergence of the catalytic approaches is leading to better conditions especially for people with sensible allergies that were previously having harder times while indoors. More developments are being made in this sectors to provide a more personal approach to these issues such as the commercialization of wearables for improved personal outdoors and indoor air quality but the prices are sometimes very high and not accessible to all citizens even in the western countries.


REFERENCES

[1]     Ten threats to global health in 2019
 https://www.who.int/emergencies/ten-threats-to-global-health-in-2019

 [2]    Huang, Y., Sai, S., Ho, H., Lu, Y., Niu, R., Xu, L., … Ho, W.-K. molecules Removal of Indoor Volatile Organic Compounds via Photocatalytic Oxidation: A Short Review and Prospect. https://doi.org/10.3390/molecules21010056

[3]     AIR FOR LIFE LIMITED
https://www.airforlife.net/index.php?page=nasa_dev

[4]     D. Yogi Goswami | PhD | University of South Florida, FL | USF | Clean Energy Research Center. (n.d.). Retrieved April 15, 2019, from https://www.researchgate.net/profile/D_Goswami2

[5]     PECO Technology Review
https://assets.molekule.com/Molekule+White+Paper+-+PECO.pdf


Humans As Sources Of Indoor Particles And Gases

Breathing is a main need for a person to live. In average, we inhale 11.000 litres of air per day1. Bad air quality is a risk for humans. According to the World Health Organization the number of deaths caused by a bad air quality in 2017 reached 4,2 million people2. The effects on humans of a bad air quality air are various and dangerous. As we already know: stroke, heart disease, lung cancer, chronic and acute respiratory diseases, reduced lung function, mortality, and many others can be some of the consequences of a poor air quality3. It is not only about well-being but also about socio-economic costs due to air quality. In France a study was done to evaluate the economic effect of some indoor pollutants such as benzene, tricholoethylene, radon, carbon monoxide, particles (PM2.5 fraction), and environmental tabacco smokes (ETS)4. The results were deterministic, the cost to the French government in 2004 was about 20 billion euros4. The major effect was caused by particles, followed by Radon.

With this brief introduction we can realize that we need to have an accurate control of the air quality. In our society a popular awareness of the outdoors air quality exists. However, it sometime forgets about the importance of indoor ambiance. A person on average spends more than 85% of his day indoors5: at his house, office, transport or other buildings . In addition, some of the pollutants have their highest concentrations in indoor ambiances. This takes us to the importance of indoor air quality performance. 

In this article we want to highlight how humans are a source of pollutants for indoor air. To do so, an analysis of the different sources for indoor pollutants is done, not only for particulate matter but also for gases. In addition, a practical example of how humans affect the indoor concentration levels of COis going to be shown.

Outdoors air, cooking, smoking, building materials, cleaning products, arranging papers, pets or humans themselves can be sources of indoor pollutants6. As we can see, almost all the main sources come from either humans or from their actions. Outdoors PM sources such as industries, heating plants, constructions and traffic contribute to indoor PM concentration levels. Outdoors air is an indoor pollutant source due to the exchange of air when ventilating, infiltration through cracks and gaps in the building structure. The type of ventilation, either natural or mechanical varies the influence of this source. Also, the magnitude of the air exchange rate. This factor depends a lot on human behaviour, depending on how often does the user ventilates his room, the number of opened windows or the position of them.

Humans and their activities are sources of indoor particulate matter. Cleaning, smoking, cooking and ironing are some human actions that generate matter or resuspension inside a building and contribute to a bigger concentration of indoor air PM. All these different sources affect in a different way and each of them are more related to a specific type of PM. Ultra-Fine Particles (UFP) have their source in tabaco, cleaning products, candles, toasters, cooking, stoves, and terpene emissions from consumer products. Bigger particles such as PM2.5 and PM10, have their source in cleaning actions such as sweeping, making the bed or removing dust, also in humans’ movements such as doing physical activity and walking at home and also shedding from skin and clothing.

In a recent study at Berkeley University, the emission rates of particle larger than 1µm form a person while walking and seated on a chair was measured. While walking the emission was, on average, 20 million particles per hour. When seated, 8 million per hour6. This shows us the influence of such a common human activity as walking

Another important thing to take into account is the more elevated exposure levels that a human has comparing with the rest of the room exposure concentrations. We call this effect the personal cloud. In order to measure this personal exposure a direct personal exposure assessment is used. The exposure data obtained with this method is usually higher than the obtained with a fixed monitor in a room. People are source of pollutants and are surrounded by the highest concentration levels of them.

From combustion sources, Carbon Monoxide (CO), Nitrogen Dioxide (NO2), Nitrogen Oxide (NO) and Carbon Dioxide (CO2) are the some of the main indoor pollutants. Carbon Monoxide is a colourless, odourless and tasteless gas, very dangerous to humans’ health and has its source in uncomplete combustions. Combustions from heaters, gas stoves or cars inside garages. Nitrogen Dioxide is also a tasteless and colourless gas with a strong odor. It can affect the lung or provoke other respiratory problems. Some of its sources are gas stoves, woodburning, vehicles and tobacco. Nitrogen Oxide, a colourless gas, has its sources on vehicles combustions, coal burning, tabaco or gas stoves can be some of its sources7. Again, we see that humans’ actions as smoking or cooking can be the main sources of these gases and humans themselves are also a source of them.

Even though CO2 plays an important role in life development, it is still considered as a pollutant if we take into account the legal definition of air pollutants8. A maximum threshold of 1000ppm is stablished for an acceptable air quality. In this article not only an analysis of humans as a source of pollutants is done but also a test to prove how humans can be a source of CO2. An experiment was done in a 12m2 bedroom from a students’ residence building to check how the CO2 levels increase with human’s occupancy. This building was based in a neighbourhood of the centre of Lausanne. The bedroom had a bed, a wardrove, a working table with a chair, direct access to a small bathroom and a big window as show in Figure 1. There was not any special source of CO2 to take into account but the user.

The test consisted on measuring the CO2 levels of the room during 4 days. Also, the occupancy data was taken with a personal user’s diary. The user was asked to note down the arriving time and departing time from his bedroom. This data is shown in the Figure 2 and allows us to make a comparison between CO2levels and occupancy. The results are show in the Figure 2 and they prove the proposed idea.

The experiment started on Thursday 11th April 2019 and finished on Sunday 14th April 2019. The results are conclusive. As we can see during the first third of the experiment, the CO2 levels raised from 500 ppm up to 700 on average each time that the user was inside his room. At 10.37 am of Friday 12th, the user took the decision of opening the bedroom’s window. This action explains why the CO2 levels after this moment become lower. With no occupancy the levels go down to 400 COppm. And with occupancy they go up to 600 CO2 ppm. On Saturday evening the user arrived home at 19:45 and stayed only for 15 minutes. Even though this was a short period of time, we can see how the CO2 levels increased 100 CO2 ppm. With this small experiment it is shown that humans are a source of CO2. Being CO2 one of the main indoor pollutants. The same test could be done with PM and other gases and the results might be as conclusive as this one.

To sum up, humans are not only the victims of poor indoor air quality but also a cause of it. Humans and their activities are sources of indoor particulate matter and pollutant gases. Due to the called personal cloud, humans’ real exposure to pollutants tends to be higher than the well mixed air measured levels.

  1. How much oxygen does a person consume in a day? | HowStuffWorks. Available at: https://health.howstuffworks.com/human-body/systems/respiratory/question98.htm. (Accessed: 14th April 2019)
  2. World Health Organization (WHO). Ambient Air Pollution: A Global Assessment of Exposure and Burden of Disease; World Health Organization (WHO): Geneva, Switzerland, 2016; ISBN 9789241511353.
  3. Practice, B. on P. H. and P. H., Division, H. and M. & National Academies of Sciences, E. and M. Sources of Indoor Particulate Matter. (2016).
  4. Boulanger, G. et al. Socio-economic costs of indoor air pollution: A tentative estimation for some pollutants of health interest in France. Environ. Int. 104, 14–24 (2017).
  5. Simoni, M. et al. The Po River Delta (North Italy) Indoor Epidemiological Study: Home Characteristics, Indoor Pollutants, and Subjects’ Daily Activity Pattern. Indoor Air 8, 70–79 (1998).
  6. UC Berkeley UC Berkeley Previously Published Works Title Emission rates and the personal cloud effect associated with particle release from the perihuman environment. doi:10.1111/ina.12365
  7. Alberts, W. M. Indoor air pollution: NO, NO2, CO, and CO2. J. Allergy Clin. Immunol. 94, 289–95 (1994).
  8. Is CO2 a pollutant? Available at: https://www.skepticalscience.com/co2-pollutant-advanced.htm. (Accessed: 14th April 2019)
  9. How much oxygen does a person consume in a day? | HowStuffWorks. Available at: https://health.howstuffworks.com/human-body/systems/respiratory/question98.htm. (Accessed: 14th April 2019)
  10. World Health Organization (WHO). Ambient Air Pollution: A Global Assessment of Exposure and Burden of Disease; World Health Organization (WHO): Geneva, Switzerland, 2016; ISBN 9789241511353.
  11. Practice, B. on P. H. and P. H., Division, H. and M. & National Academies of Sciences, E. and M. Sources of Indoor Particulate Matter. (2016).
  12. Boulanger, G. et al. Socio-economic costs of indoor air pollution: A tentative estimation for some pollutants of health interest in France. Environ. Int. 104, 14–24 (2017).
  13. Simoni, M. et al. The Po River Delta (North Italy) Indoor Epidemiological Study: Home Characteristics, Indoor Pollutants, and Subjects’ Daily Activity Pattern. Indoor Air 8, 70–79 (1998).
  14. Alberts, W. M. Indoor air pollution: NO, NO2, CO, and CO2. J. Allergy Clin. Immunol. 94, 289–95 (1994).