
Breathing is a main need for a person to live. In average, we inhale 11.000 litres of air per day1. Bad air quality is a risk for humans. According to the World Health Organization the number of deaths caused by a bad air quality in 2017 reached 4,2 million people2. The effects on humans of a bad air quality air are various and dangerous. As we already know: stroke, heart disease, lung cancer, chronic and acute respiratory diseases, reduced lung function, mortality, and many others can be some of the consequences of a poor air quality3. It is not only about well-being but also about socio-economic costs due to air quality. In France a study was done to evaluate the economic effect of some indoor pollutants such as benzene, tricholoethylene, radon, carbon monoxide, particles (PM2.5 fraction), and environmental tabacco smokes (ETS)4. The results were deterministic, the cost to the French government in 2004 was about 20 billion euros4. The major effect was caused by particles, followed by Radon.
With this brief introduction we can realize that we need to have an accurate control of the air quality. In our society a popular awareness of the outdoors air quality exists. However, it sometime forgets about the importance of indoor ambiance. A person on average spends more than 85% of his day indoors5: at his house, office, transport or other buildings . In addition, some of the pollutants have their highest concentrations in indoor ambiances. This takes us to the importance of indoor air quality performance.
In this article we want to highlight how humans are a source of pollutants for indoor air. To do so, an analysis of the different sources for indoor pollutants is done, not only for particulate matter but also for gases. In addition, a practical example of how humans affect the indoor concentration levels of CO2 is going to be shown.
Outdoors air, cooking, smoking, building materials, cleaning products, arranging papers, pets or humans themselves can be sources of indoor pollutants6. As we can see, almost all the main sources come from either humans or from their actions. Outdoors PM sources such as industries, heating plants, constructions and traffic contribute to indoor PM concentration levels. Outdoors air is an indoor pollutant source due to the exchange of air when ventilating, infiltration through cracks and gaps in the building structure. The type of ventilation, either natural or mechanical varies the influence of this source. Also, the magnitude of the air exchange rate. This factor depends a lot on human behaviour, depending on how often does the user ventilates his room, the number of opened windows or the position of them.
Humans and their activities are sources of indoor particulate matter. Cleaning, smoking, cooking and ironing are some human actions that generate matter or resuspension inside a building and contribute to a bigger concentration of indoor air PM. All these different sources affect in a different way and each of them are more related to a specific type of PM. Ultra-Fine Particles (UFP) have their source in tabaco, cleaning products, candles, toasters, cooking, stoves, and terpene emissions from consumer products. Bigger particles such as PM2.5 and PM10, have their source in cleaning actions such as sweeping, making the bed or removing dust, also in humans’ movements such as doing physical activity and walking at home and also shedding from skin and clothing.
In a recent study at Berkeley University, the emission rates of particle larger than 1µm form a person while walking and seated on a chair was measured. While walking the emission was, on average, 20 million particles per hour. When seated, 8 million per hour6. This shows us the influence of such a common human activity as walking
Another important thing to take into account is the more elevated exposure levels that a human has comparing with the rest of the room exposure concentrations. We call this effect the personal cloud. In order to measure this personal exposure a direct personal exposure assessment is used. The exposure data obtained with this method is usually higher than the obtained with a fixed monitor in a room. People are source of pollutants and are surrounded by the highest concentration levels of them.
From combustion sources, Carbon Monoxide (CO), Nitrogen Dioxide (NO2), Nitrogen Oxide (NO) and Carbon Dioxide (CO2) are the some of the main indoor pollutants. Carbon Monoxide is a colourless, odourless and tasteless gas, very dangerous to humans’ health and has its source in uncomplete combustions. Combustions from heaters, gas stoves or cars inside garages. Nitrogen Dioxide is also a tasteless and colourless gas with a strong odor. It can affect the lung or provoke other respiratory problems. Some of its sources are gas stoves, woodburning, vehicles and tobacco. Nitrogen Oxide, a colourless gas, has its sources on vehicles combustions, coal burning, tabaco or gas stoves can be some of its sources7. Again, we see that humans’ actions as smoking or cooking can be the main sources of these gases and humans themselves are also a source of them.
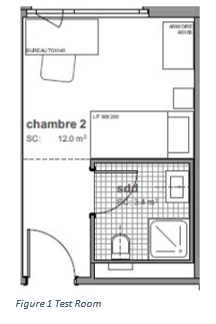
Even though CO2 plays an important role in life development, it is still considered as a pollutant if we take into account the legal definition of air pollutants8. A maximum threshold of 1000ppm is stablished for an acceptable air quality. In this article not only an analysis of humans as a source of pollutants is done but also a test to prove how humans can be a source of CO2. An experiment was done in a 12m2 bedroom from a students’ residence building to check how the CO2 levels increase with human’s occupancy. This building was based in a neighbourhood of the centre of Lausanne. The bedroom had a bed, a wardrove, a working table with a chair, direct access to a small bathroom and a big window as show in Figure 1. There was not any special source of CO2 to take into account but the user.
The test consisted on measuring the CO2 levels of the room during 4 days. Also, the occupancy data was taken with a personal user’s diary. The user was asked to note down the arriving time and departing time from his bedroom. This data is shown in the Figure 2 and allows us to make a comparison between CO2levels and occupancy. The results are show in the Figure 2 and they prove the proposed idea.
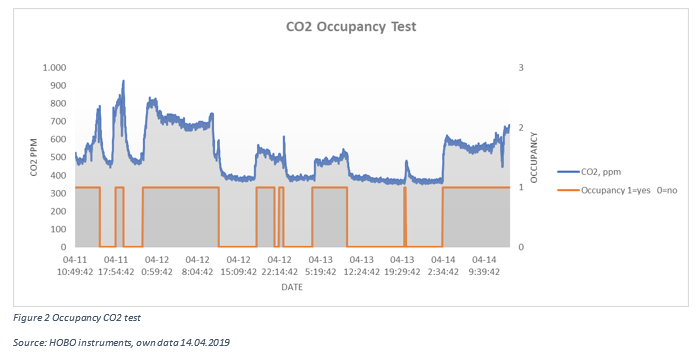
The experiment started on Thursday 11th April 2019 and finished on Sunday 14th April 2019. The results are conclusive. As we can see during the first third of the experiment, the CO2 levels raised from 500 ppm up to 700 on average each time that the user was inside his room. At 10.37 am of Friday 12th, the user took the decision of opening the bedroom’s window. This action explains why the CO2 levels after this moment become lower. With no occupancy the levels go down to 400 CO2 ppm. And with occupancy they go up to 600 CO2 ppm. On Saturday evening the user arrived home at 19:45 and stayed only for 15 minutes. Even though this was a short period of time, we can see how the CO2 levels increased 100 CO2 ppm. With this small experiment it is shown that humans are a source of CO2. Being CO2 one of the main indoor pollutants. The same test could be done with PM and other gases and the results might be as conclusive as this one.
To sum up, humans are not only the victims of poor indoor air quality but also a cause of it. Humans and their activities are sources of indoor particulate matter and pollutant gases. Due to the called personal cloud, humans’ real exposure to pollutants tends to be higher than the well mixed air measured levels.
- How much oxygen does a person consume in a day? | HowStuffWorks. Available at: https://health.howstuffworks.com/human-body/systems/respiratory/question98.htm. (Accessed: 14th April 2019)
- World Health Organization (WHO). Ambient Air Pollution: A Global Assessment of Exposure and Burden of Disease; World Health Organization (WHO): Geneva, Switzerland, 2016; ISBN 9789241511353.
- Practice, B. on P. H. and P. H., Division, H. and M. & National Academies of Sciences, E. and M. Sources of Indoor Particulate Matter. (2016).
- Boulanger, G. et al. Socio-economic costs of indoor air pollution: A tentative estimation for some pollutants of health interest in France. Environ. Int. 104, 14–24 (2017).
- Simoni, M. et al. The Po River Delta (North Italy) Indoor Epidemiological Study: Home Characteristics, Indoor Pollutants, and Subjects’ Daily Activity Pattern. Indoor Air 8, 70–79 (1998).
- UC Berkeley UC Berkeley Previously Published Works Title Emission rates and the personal cloud effect associated with particle release from the perihuman environment. doi:10.1111/ina.12365
- Alberts, W. M. Indoor air pollution: NO, NO2, CO, and CO2. J. Allergy Clin. Immunol. 94, 289–95 (1994).
- Is CO2 a pollutant? Available at: https://www.skepticalscience.com/co2-pollutant-advanced.htm. (Accessed: 14th April 2019)
- How much oxygen does a person consume in a day? | HowStuffWorks. Available at: https://health.howstuffworks.com/human-body/systems/respiratory/question98.htm. (Accessed: 14th April 2019)
- World Health Organization (WHO). Ambient Air Pollution: A Global Assessment of Exposure and Burden of Disease; World Health Organization (WHO): Geneva, Switzerland, 2016; ISBN 9789241511353.
- Practice, B. on P. H. and P. H., Division, H. and M. & National Academies of Sciences, E. and M. Sources of Indoor Particulate Matter. (2016).
- Boulanger, G. et al. Socio-economic costs of indoor air pollution: A tentative estimation for some pollutants of health interest in France. Environ. Int. 104, 14–24 (2017).
- Simoni, M. et al. The Po River Delta (North Italy) Indoor Epidemiological Study: Home Characteristics, Indoor Pollutants, and Subjects’ Daily Activity Pattern. Indoor Air 8, 70–79 (1998).
- Alberts, W. M. Indoor air pollution: NO, NO2, CO, and CO2. J. Allergy Clin. Immunol. 94, 289–95 (1994).